Updated: September 24, 2018
During the summer months, we know that farmers across Ontario are watching the weather, especially for rain. Just the right amount of rain at the right time is never guaranteed, and too little or too much rain can be harmful to farm businesses.
Not only does weather affect crop yields, but it could also affect market supply and demand. That's why over 20,000 farm businesses are enrolled in
AgriStability, Ontario's
Risk Management Program and
Production Insurance, with over 5 million acres covered under Production Insurance plans.
Agricorp is here to help. Farmers who have concerns about their program coverage should contact Agricorp to make sure they have the information they need to make decisions that are best for their farm – because every situation is unique.
To see how much rain has fallen across the province compared to normal, see the May, June, July and August rainfall maps below or check out the monthly rainfall data.
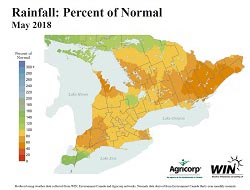 May 2018 rainfall map
Click to view map 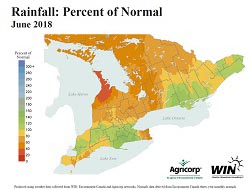 June 2018 rainfall map
Click to view map 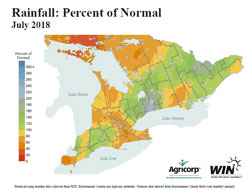 July 2018 rainfall map
Click to view map
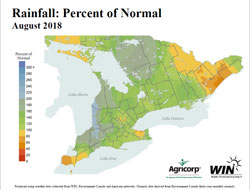 August 2018 rainfall map
Click to view map
Related stories