August 19, 2020 | Updated: September 16, 2020
It is the time of year when farmers across Ontario are paying close attention to rainfall. During spring and summer, too much or too little rainfall can pose challenges for farm businesses. This year, rainfall has varied across the province.
To see how much rain has fallen across the province compared to normal, see the May, June, July and August rainfall maps below, or check out the monthly rainfall data on agricorp.com.
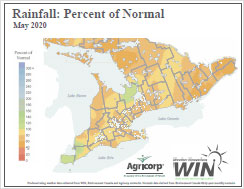 May 2020 rainfall map
Click to view map
(465 KB)
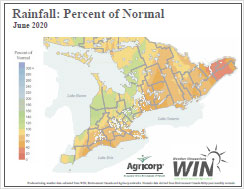 June 2020 rainfall map
Click to view map
(466 KB)
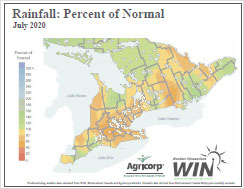 July 2020 rainfall map
Click to view map
(465 KB)
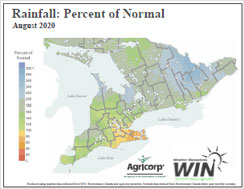 August 2020 rainfall map
Click to view map
(469 KB)
How Production Insurance can help – forage rainfall plan
Weather can play a big role in crop yields, which is why thousands of farmers enrol in
Production Insurance each year. The Production Insurance plan for forage rainfall helps farmers manage the impact of forage shortages and quality reductions due to rainfall variability.
Customers in the forage rainfall plan can have coverage for both excess and insufficient rainfall. The plan assumes a relationship between rainfall and yield and compensates farmers for too much or too little rainfall, depending on the coverage they selected.
Payments for the insufficient rainfall coverage option will be made in September.
To learn more about forage rainfall coverage, visit agricorp.com.
Agricorp is here to help. Farmers who have concerns about their program coverage can contact Agricorp for assistance.