January 15, 2021
Ontario
corn and
soybean farmers saw slightly above average corn yields and high soybean yields in 2020.
While some parts of the province experienced lower yields due to a lack of rain, yields were strong overall. The provincial average for corn yields was 177 bushels per acre, just above the 10-year average of 174 bushels per acre. Soybean farmers saw average yields of 52 bushels per acre, well above the 10-year average of 46 bushels per acre.
This year was an improvement for farmers from a challenging 2019, when they received more than $280 million in Production Insurance payments from Agricorp.
The yield maps below show 2020 Ontario corn and soybean yields from farmers enrolled in Production Insurance.
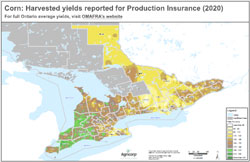 2020 corn yields
Click to view yield map
(2.87 MB) 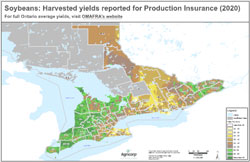 2020 soybean yields
Click to view yield map
(3.13 MB)
How do higher yields affect program coverage?
Higher yields can lead to higher Production Insurance coverage in future years, when producers need it.
Because Production Insurance coverage is based on a producer's individual yield history, an above-average yield raises a producer's average farm yield (AFY). The higher a producer's AFY, the higher the level of production Agricorp guarantees.
For more information, read the
 Average Farm Yield feature sheet.
How do lower yields affect coverage?
Some farmers may be concerned about the possibility that a lower than average yield in 2020 could reduce their AFY. An AFY reflects a producer's yield history and is used as a benchmark to determine if production is below average. This means that unusually high and low yields are buffered to stabilize a customer's AFY and lessen the impact of extreme yields.
For more information, read the
Yield Buffering.