January 22, 2026
Ontario farmers saw average
corn yields and below-average
soybean yields in 2025, after a dry summer that affected growth in many areas.
Production Insurance customers reported an average of 191 bushels of corn per acre, which is the 10-year average. Soybeans averaged 46 bushels per acre, which is 6% lower than the 10-year average of 50 bushels per acre.
See Production Insurance
farm yield data by county for corn, soybeans, spring wheat, spring grains, edible beans, canola, oats, and barley.
The data Agricorp provides reflects yields reported to date. Additional updates will be made this spring as more yield information becomes available.
View the provincial maps:
 2025 Corn Yield Map
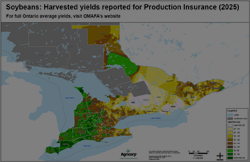 2025 Soybean Yield Map
For full Ontario average yields, visit the
Ontario Ministry of Agriculture, Food and Agribusiness statistics site.
When yields fall short, Production Insurance is there to help
Where yields were lower due to dry weather conditions in the summer, Production Insurance was there to help.
Production Insurance covers farmers for production and quality losses due to adverse weather, disease, pests, wildlife, or other uncontrollable natural perils. Farmers are guaranteed a level of production based on their yield history and the level of coverage they choose.
How do lower yields affect program coverage?
One bad production year doesn't significantly impact a farmer's 10-year Average Farm Yield (AFY). Unusually low (or high) yields are buffered to stabilize the AFY and lessen the impact of extreme yields. A stable AFY means stable and dependable coverage.
For more information, read the
Yield Buffering feature sheet.